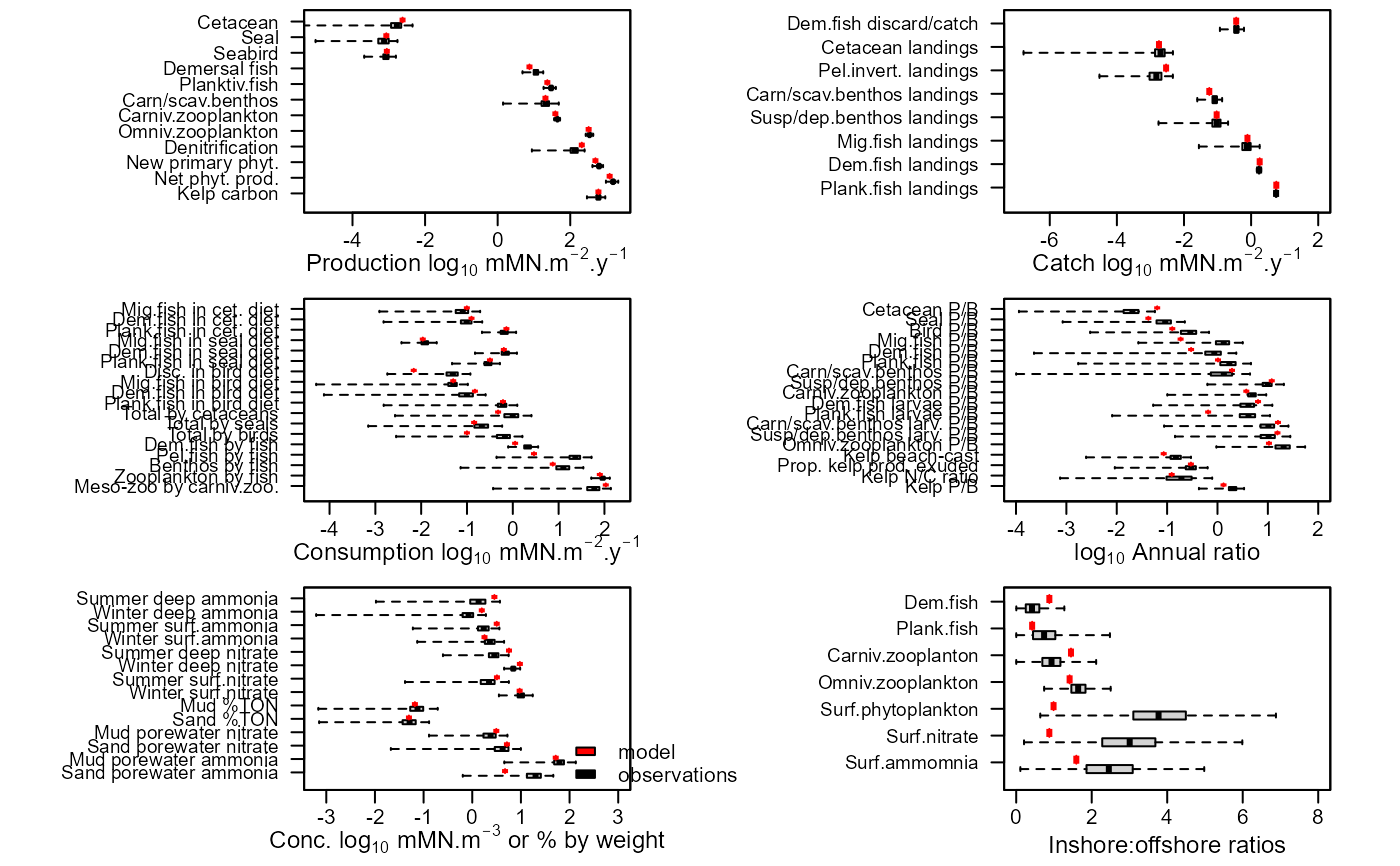
Box and whisker plots comparing annual or monthly observational data with corresponding model outputs.
e2e_compare_obs.RdGenerate a multi-panel set of box and whisker diagrams comparing annual or monthly averaged or integrated observational data on the state of the ecosystem with corresponding model outputs. Each panel displays a different category of observational and model data.
Usage
e2e_compare_obs(
  selection = "ANNUAL",
  model,
  ci.data = FALSE,
  use.saved = FALSE,
  use.example = FALSE,
  results = NULL
)
Arguments
- selection
Text string from a list to select comparison with annual or monthly observations. Select from: "ANNUAL", "MONTHLY". Remember to include the phrase within "" quotes.
- model
R-list object defining the baseline model configuration used to generate the data and compiled by the e2e_read() function.
- ci.data
Logical. If TRUE plot credible intervals around model results based on Monte Carlo simulation with the e2e_run_mc() function (default=FALSE).
- use.saved
Logical. If TRUE use data from a prior user-defined run held as csv files data in the current results folder (default=FALSE).
- use.example
Logical. If TRUE use pre-computed example data from the internal North Sea model rather than user-generated data (default=FALSE).
- results
R-list object of model output generated by the e2e_run() function (default=NULL).
Details
The observational data are read from the file 'annual_observed_*.csv' or 'monthly_observed_*.csv'in the /Target folder of the model setup defined by a e2e_read() function call. Column 3 of annual_observed_* (header "Use_1.yes_0.no") is a flag to set whether any given row is used in calculating the likelihood of the observed data given the model setup by functions such as e2e_optimize_eco(). Un-used rows of data are omitted from the box and whisker plotting panels.
Arguments determine the source of model data for comparison with the observations. These can be outputs from a single model run with data held in memory as a list object or in a saved csv file, or from a Monte Carlo simulation (using the function e2e_run_mc()) to estimate credible intervals of model outputs. Generation of credible interval data is a long computing task, so example data for the North Sea model provided with the package for illustration.
In each plot panel, the distribution of observation data is shown by a black box plot (box spans 50 derived from model outputs are always shown in red - either a red tick mark for data from a single model run, or a red boxplot for data from a Monte Carlo analysis.
Examples
# Load the 1970-1999 version of the North Sea model supplied with the package, run,
# and generate a plot:
    model <- e2e_read("North_Sea", "1970-1999")
#> Current working directory is...
#> 'C:/Users/jackl/OneDrive - University of Strathclyde/Documents/Research/Packages/StrathE2E/strathe2e2/docs/reference'
#> No 'results.path' specified so any csv data requested
#> will be directed to/from the temporary directory...
#> 'C:\Users\jackl\AppData\Local\Temp\RtmpC42d8N'
#>
#> Model setup and parameters gathered from ...
#> StrathE2E2 package folder
#> Model results will be directed to/from ...
#> 'C:\Users\jackl\AppData\Local\Temp\RtmpC42d8N/North_Sea/1970-1999/'
    results <- e2e_run(model, nyears=2,csv.output=FALSE)
# Plot data annual data
    e2e_compare_obs(selection="ANNUAL", model, results=results)

# Note that these are the observational data that were used as the target for optimizing
# the model parameters

# Direct the graphics output to a file ... in this example the graphics file
# is sent to a temporary folder rather than the current working directory:
# or jpeg("plot.jpg"), png("plot.png")
    pdf(file.path(tempdir(), "plot.pdf"),width=8,height=6)
    e2e_compare_obs(selection="ANNUAL", model, results=results)
    dev.off()
#> agg_record_432744511
#>                    2

# Plot monthly data
    dev.new()
    e2e_compare_obs(model, selection="MONTHLY",results=results)
# Note that these observational data were NOT used for optimizing the
# model parameters

# \donttest{
# To create the same plots from the csv files saved by the e2e_run() function, use:
    model <- e2e_read("North_Sea", "1970-1999")
#> Current working directory is...
#> 'C:/Users/jackl/OneDrive - University of Strathclyde/Documents/Research/Packages/StrathE2E/strathe2e2/docs/reference'
#> No 'results.path' specified so any csv data requested
#> will be directed to/from the temporary directory...
#> 'C:\Users\jackl\AppData\Local\Temp\RtmpC42d8N'
#>
#> Model setup and parameters gathered from ...
#> StrathE2E2 package folder
#> Model results will be directed to/from ...
#> 'C:\Users\jackl\AppData\Local\Temp\RtmpC42d8N/North_Sea/1970-1999/'
    results <- e2e_run(model, nyears=2,csv.output=TRUE)
# Here the csv outputs are saved to a temporary folder since results.path is not
# set in e2e_read()
    e2e_compare_obs(selection="ANNUAL", model, use.saved=TRUE)
#> [1] "Using data held in a file  C:\\Users\\jackl\\AppData\\Local\\Temp\\RtmpC42d8N/North_Sea/1970-1999/model_target_annualresults_plus_chi-base.csv  from a past model run"
    dev.new()
    e2e_compare_obs(selection="MONTHLY", model, use.saved=TRUE)
#> [1] "Using data held in a file  C:\\Users\\jackl\\AppData\\Local\\Temp\\RtmpC42d8N/North_Sea/1970-1999/model_monthlyresults-base.csv  from a past model run"
# }

# Load the 1970-1999 version of the North Sea model supplied with the package and plot
# example data with credible intervals generated by a baseline mode Monte Carlo analysis.
# This example requires the Strathe2E2examples supplementary data package.
if(require(StrathE2E2examples)){
    model <- e2e_read("North_Sea", "1970-1999")
    e2e_compare_obs(model, selection="ANNUAL",ci.data=TRUE,use.example=TRUE)
    dev.new()
    e2e_compare_obs(selection="MONTHLY", model, ci.data=TRUE,use.example=TRUE)
}
#> Loading required package: StrathE2E2examples
#> Warning: there is no package called 'StrathE2E2examples'
# Note that these are the observational data that were used as the target for optimizing
# the model parameters
# Direct the graphics output to a file ... in this example the graphics file
# is sent to a temporary folder rather than the current working directory:
# or jpeg("plot.jpg"), png("plot.png")
pdf(file.path(tempdir(), "plot.pdf"),width=8,height=6)
e2e_compare_obs(selection="ANNUAL", model, results=results)
dev.off()
#> agg_record_432744511
#> 2
# Plot monthly data
dev.new()
e2e_compare_obs(model, selection="MONTHLY",results=results)
# Note that these observational data were NOT used for optimizing the
# model parameters
# \donttest{
# To create the same plots from the csv files saved by the e2e_run() function, use:
model <- e2e_read("North_Sea", "1970-1999")
#> Current working directory is...
#> 'C:/Users/jackl/OneDrive - University of Strathclyde/Documents/Research/Packages/StrathE2E/strathe2e2/docs/reference'
#> No 'results.path' specified so any csv data requested
#> will be directed to/from the temporary directory...
#> 'C:\Users\jackl\AppData\Local\Temp\RtmpC42d8N'
#>
#> Model setup and parameters gathered from ...
#> StrathE2E2 package folder
#> Model results will be directed to/from ...
#> 'C:\Users\jackl\AppData\Local\Temp\RtmpC42d8N/North_Sea/1970-1999/'
results <- e2e_run(model, nyears=2,csv.output=TRUE)
# Here the csv outputs are saved to a temporary folder since results.path is not
# set in e2e_read()
e2e_compare_obs(selection="ANNUAL", model, use.saved=TRUE)
#> [1] "Using data held in a file C:\\Users\\jackl\\AppData\\Local\\Temp\\RtmpC42d8N/North_Sea/1970-1999/model_target_annualresults_plus_chi-base.csv from a past model run"
dev.new()
e2e_compare_obs(selection="MONTHLY", model, use.saved=TRUE)
#> [1] "Using data held in a file C:\\Users\\jackl\\AppData\\Local\\Temp\\RtmpC42d8N/North_Sea/1970-1999/model_monthlyresults-base.csv from a past model run"
# }
# Load the 1970-1999 version of the North Sea model supplied with the package and plot
# example data with credible intervals generated by a baseline mode Monte Carlo analysis.
# This example requires the Strathe2E2examples supplementary data package.
if(require(StrathE2E2examples)){
model <- e2e_read("North_Sea", "1970-1999")
e2e_compare_obs(model, selection="ANNUAL",ci.data=TRUE,use.example=TRUE)
dev.new()
e2e_compare_obs(selection="MONTHLY", model, ci.data=TRUE,use.example=TRUE)
}
#> Loading required package: StrathE2E2examples
#> Warning: there is no package called 'StrathE2E2examples'