Chapter 8 Fishery yield curves - a special type of scenario analysis
Fishery yield curves show the steady state response of biomass and catch of a guild to fishing mortality (harvest ratio).
The catch response should be dome-shaped with the peak representing Maximum Sustainable Yield (MSY). The fishing mortality at MSY is called FMSY.
It is relatively straightforward to write a script to loop through a sequence of harvest ratio multipliers, run the model and save the relevant results:
- Set up a dataframe to hold the results
- Set up a loop to cycle through multipliers of harvest ratio (ie fishing mortality rate)
- Each loop, run the model to a steady state (minimum 20 years) for the current value of the harvest ratio multiplier
- Each loop, accumulate the annual average masses of each food web component and the annual landings and discards in the results dataframe
- On completion, plot the annual average mass and catch of planktivorous or demersal fish against the harvest ratio multiplier
model<-e2e_read("North_Sea","1970-1999")

PFHRvector <- seq(0,3,by=0.5)  # set up the vector of harvest ratios
Nsteps     <- length(PFHRvector)

#setup data store to hold the results
datastore<-data.frame(PFHR<-PFHRvector,PlankFishbiom<-rep(0,Nsteps),PlankFishland<-rep(0,Nsteps),PlankFishdisc<-rep(0,Nsteps))

nyr<-20  # number of years to run each harvest ratio - needs to be enough to achieve steady state

for(kkk in 1:(Nsteps)){

message("Run ",kkk,"; pf harvest ratio multiplier = ",PFHRvector[kkk])

model$data$fleet.model$HRscale_vector_multiplier[1]<-PFHRvector[kkk]

results<-e2e_run(model,nyears=nyr,csv.output=FALSE)

#Identify the rows of data to be pulled out of the relevent output object
PF_browid<-which(results$final.year.outputs$mass_results_wholedomain$Description=="Planktivorous_fish")
PF_lrowid<-which(results$final.year.outputs$annual_flux_results_wholedomain$Description=="Plank.fish_landings_live_weight")
PF_drowid<-which(results$final.year.outputs$annual_flux_results_wholedomain$Description=="Plank.fish_discards")

datastore$PlankFishbiom[kkk]<-results$final.year.outputs$mass_results_wholedomain[PF_browid,1]
datastore$PlankFishland[kkk]<-results$final.year.outputs$annual_flux_results_wholedomain[PF_lrowid,1]
datastore$PlankFishdisc[kkk]<-results$final.year.outputs$annual_flux_results_wholedomain[PF_drowid,1]

}

#Plot the results
par(mfrow=c(2,1))
plot(datastore$PFHR,datastore$PlankFishbiom,type="l",
      xlab="Harvest ratio mutiplier",ylab="Planktivorous fish biomass")
plot(datastore$PFHR,datastore$PlankFishland+datastore$PlankFishdisc,type="l",
      xlab="Harvest ratio mutiplier",ylab="Planktivorous fish catch")
This procedure is coded into the functions e2e_run_ycurve() and e2e_plot_ycurve() with some additional details. Check help(e2e_plot_ycurve). Here is a visualization of example data generated with e2e_run_ycurve():
# Plot example data for one of the North Sea model versions internal to the package
model <- e2e_read("North_Sea", "1970-1999",silent=TRUE)
pf_yield_data<-e2e_plot_ycurve(model, selection="PLANKTIV", use.example=TRUE)
Reading example results from StrathE2E2examples data package for the North_Sea 1970-1999 model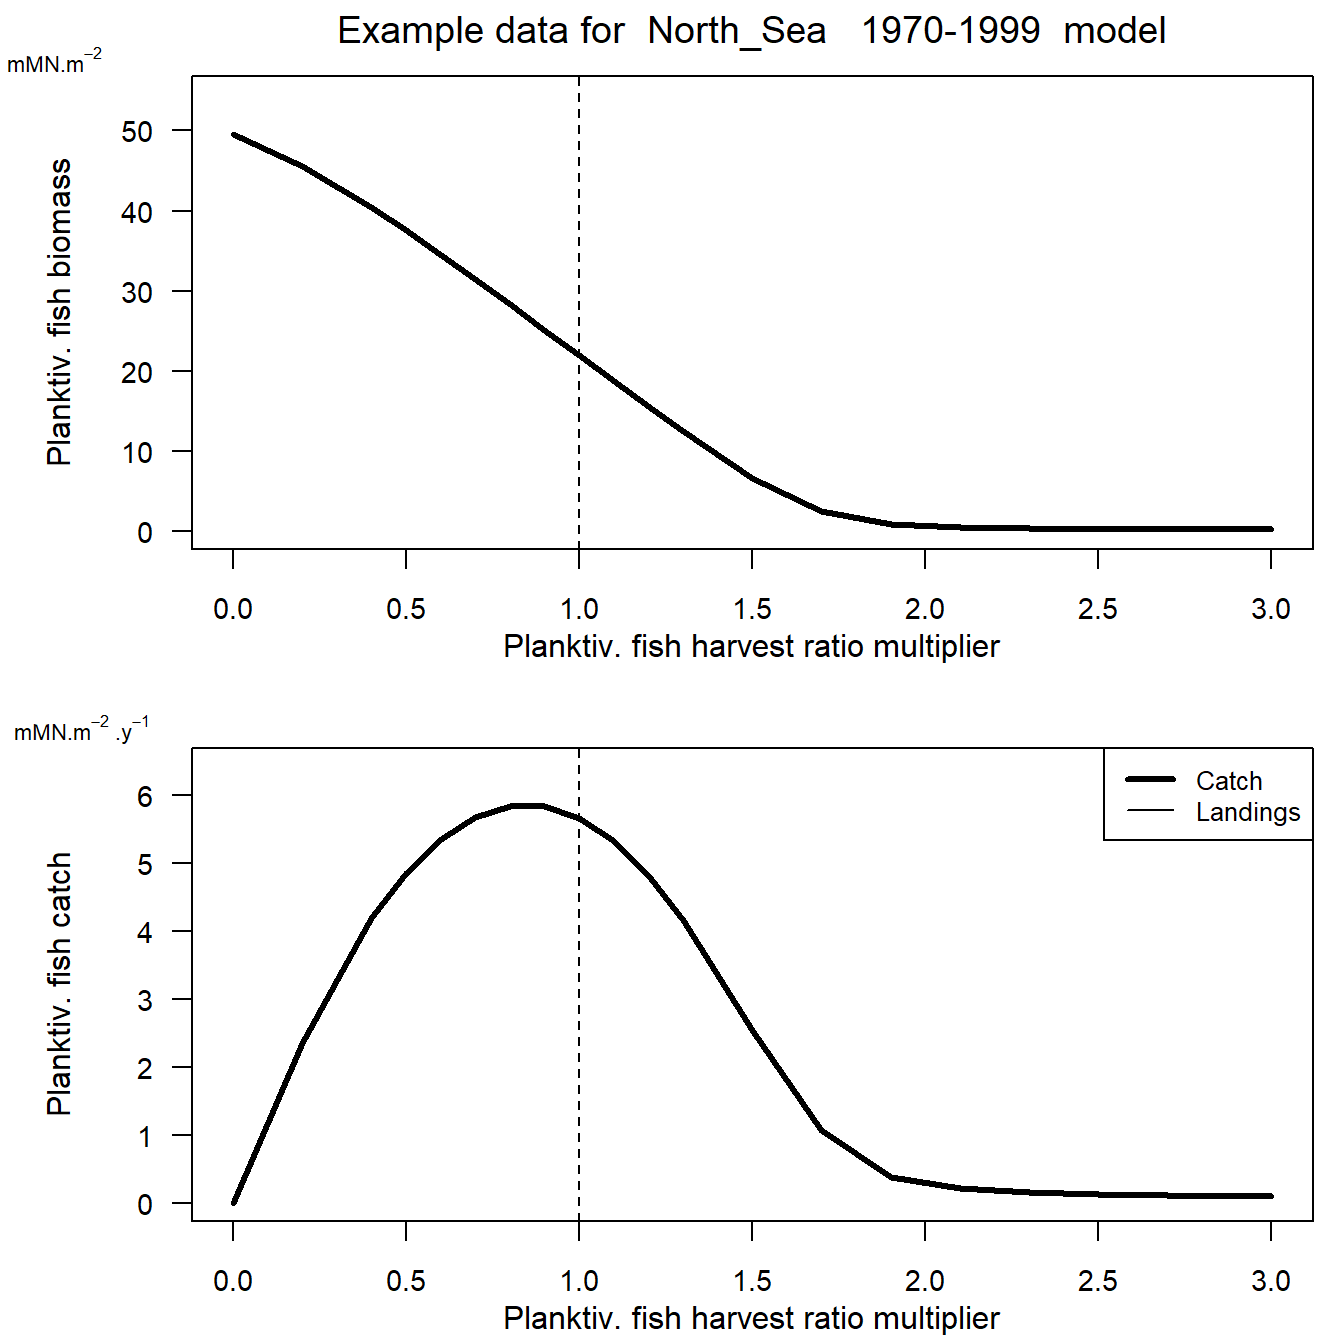 Figure 14. Yield data plot for planktivoirous fish in the 1970-1999 North Sea model with baseline demersal harvest ratios. Upper panel, annual average biomass of
planktivorous fish (mMN.m-2 in the whole modle domain) as a function of harvest ratio. Lower panel: catch divided into landings and discards of planktivorous fish (mMN.m-2.y-1) as a function of harvest ratio.
Figure 14. Yield data plot for planktivoirous fish in the 1970-1999 North Sea model with baseline demersal harvest ratios. Upper panel, annual average biomass of
planktivorous fish (mMN.m-2 in the whole modle domain) as a function of harvest ratio. Lower panel: catch divided into landings and discards of planktivorous fish (mMN.m-2.y-1) as a function of harvest ratio.
In the above example the dataframe pf_yield_data holds the masses and catches of all the other components of the food web for each increment of harvest ratio multiplier. Below is some code to visualize these data and reveal the indirect food web connectivity impacts of the gradient of planktivorous fish harvesting rates.
#First have a look at the dataframe pf_yield_data
head(pf_yield_data)
  PlankFishHRmult DemFishHRmult PlankFishbiom PlankFishland PlankFishdisc
1             0.0             1      49.60182      0.000000   0.000000000
2             0.2             1      45.53717      2.350435   0.007812564
3             0.4             1      40.46815      4.175492   0.013881520
4             0.5             1      37.56036      4.842612   0.016101612
5             0.6             1      34.50485      5.336611   0.017745678
6             0.7             1      31.40302      5.665270   0.018837143
  DemFishbiom DemFishland DemFishdisc MigFishbiom MigFishland MigFishdisc
1   0.5429663  0.08745704  0.06770612    1.854822   0.7798520   0.1897934
2   1.4744002  0.27704674  0.20522092    1.855700   0.7802267   0.1898805
3   3.5514836  0.72413974  0.48864064    1.854904   0.7798640   0.1897890
4   4.7243989  0.99029530  0.63566380    1.854077   0.7794935   0.1896979
5   5.7373503  1.22757005  0.75568829    1.853198   0.7791021   0.1896025
6   6.5250663  1.41658564  0.84484067    1.852407   0.7787506   0.1895179
  Benthsuspdepbiom Benthsuspdepland Benthsuspdepdisc Benthcarnscavbiom
1         50.38394       0.09458175     0.0005483064          9.770246
2         50.27922       0.09417077     0.0005459316          9.050089
3         50.17636       0.09385823     0.0005441198          8.672532
4         50.14555       0.09380304     0.0005437963          8.687213
5         50.13035       0.09381763     0.0005438747          8.857696
6         50.12300       0.09387306     0.0005441875          9.155849
  Benthcarnscavland Benthcarnscavdisc CarnivZoobiom CarnivZooland CarnivZoodisc
1        0.05070891        0.02912916      2.812613             0             0
2        0.04569241        0.02558717      3.390310             0             0
3        0.04294070        0.02356553      4.395327             0             0
4        0.04293470        0.02349139      5.131129             0             0
5        0.04401586        0.02418609      6.018549             0             0
6        0.04601601        0.02554877      7.007124             0             0
     Birdbiom Birdland     Birddisc Pinnipedbiom Pinnipedland Pinnipeddisc
1 0.012773516        0 1.691732e-06  0.004178594            0 6.719167e-06
2 0.011901478        0 1.571796e-06  0.006705981            0 1.365352e-05
3 0.011125727        0 1.466808e-06  0.013439402            0 3.078911e-05
4 0.010669995        0 1.405013e-06  0.016852473            0 3.961488e-05
5 0.010110695        0 1.328970e-06  0.019257713            0 4.624084e-05
6 0.009446687        0 1.238947e-06  0.020515792            0 5.033734e-05
  Cetaceanbiom Cetaceanland Cetaceandisc Macrophytebiom Macrophyteland
1   0.08222495 1.573626e-04 0.0015347621       19.80999              0
2   0.07604189 1.406299e-04 0.0013715675       19.84066              0
3   0.06946032 1.227186e-04 0.0011968782       19.84287              0
4   0.06554912 1.120964e-04 0.0010932799       19.83227              0
5   0.06104986 9.988807e-05 0.0009742112       19.81608              0
6   0.05605551 8.630867e-05 0.0008417710       19.79696              0
  Macrophytedisc Phytoplanktonbiom OmnivZoobiom
1              0          6.779332     31.83528
2              0          6.681376     32.63153
3              0          6.639763     32.97345
4              0          6.649560     32.88339
5              0          6.678847     32.61636
6              0          6.721173     32.22405

#Then make a plot of the dependence of cetaceans on planktivorous fish harvesting rate
par(mfrow=c(2,1))
par(mar=c(3.2,5,2,0.8))
ym<-1.1*max(pf_yield_data$Cetaceanbiom)
plot(pf_yield_data$PlankFishHRmult,pf_yield_data$Cetaceanbiom,ylim=c(0,ym),type="l",
     lwd=3,yaxt="n",xaxt="n",ann=FALSE)
   abline(v=1,lty="dashed")
   axis(side=1,las=1,cex.axis=0.9)
   axis(side=2,las=1,cex.axis=0.9)
   mtext("Planktiv. fish harvest ratio multiplier",cex=1,side=1,line=2)
   mtext("Cetacean biomass",cex=1,side=2,line=3.5)
   mtext(bquote("mMN.m"^-2),cex=0.7,side=3,line=-0.05,adj=-0.18)
ym<-1.1*max(pf_yield_data$Cetaceandisc)
plot(pf_yield_data$PlankFishHRmult,pf_yield_data$Cetaceandisc,ylim=c(0,ym),type="l",
     lwd=3,yaxt="n",xaxt="n",ann=FALSE)
   abline(v=1,lty="dashed")
   axis(side=1,las=1,cex.axis=0.9)
   axis(side=2,las=1,cex.axis=0.9)
   mtext("Planktiv. fish harvest ratio multiplier",cex=1,side=1,line=2)
   mtext("Cetacean by-catch",cex=1,side=2,line=3.5)
   mtext(bquote("mMN.m"^-2 ~ ".y"^-1),cex=0.7,side=3,line=-0.05,adj=-0.18)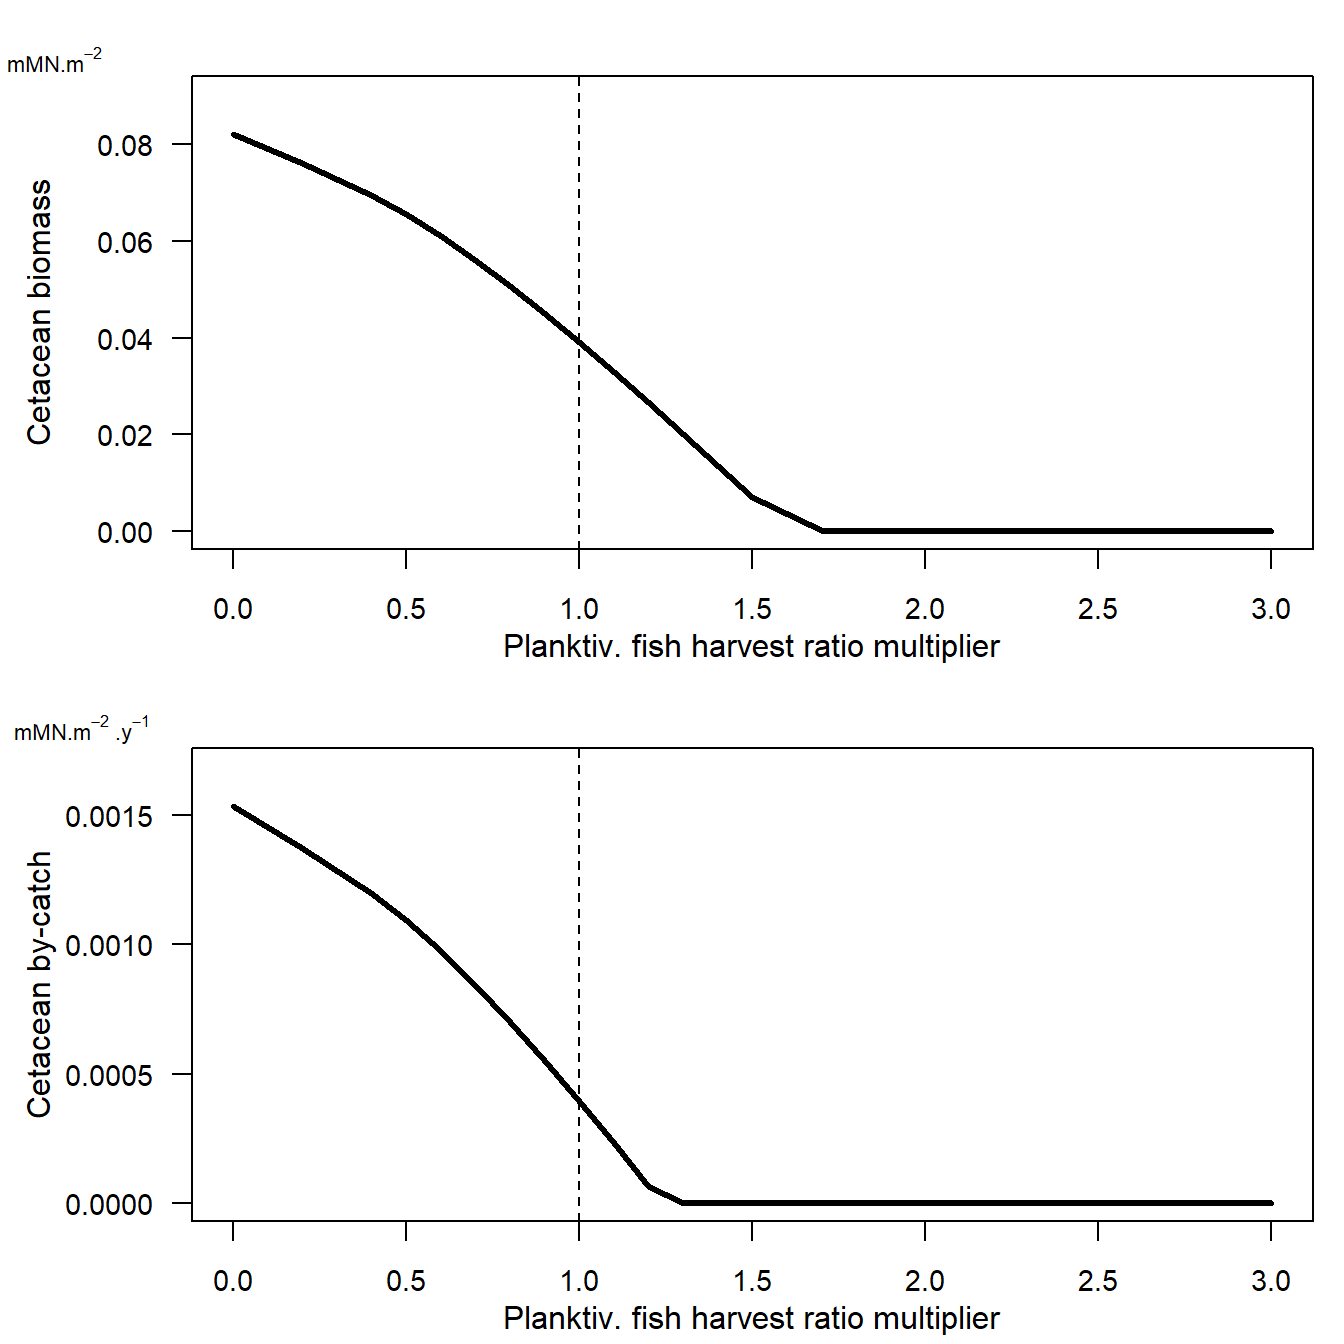
Figure 15. Example of a possible user-generated yield data plot for cetaceans in the 1970-1999 North Sea model as a function of planktivorous harvest ratio, with baseline demersal harvest ratios. Upper panel, annual average biomass of cetaceans (mMN.m-2 in the whole modle domain) as a function of planktivorous fish harvest ratio. Lower panel: catch divided into targeted landings and by-catch (discards) of cetaceans (mMN.m-2.y-1) as a function of harvest ratio.
To repeat for demersal fish, replace selection=“PLANKTIV” with selection=“DEMERSAL”