Chapter 5 Run a model and plot basic results
e2e_run() is a key function in the package which returns a list object which contains all of the output data from a model run.
e2e_plot_ts() with the arguments model object name, results object name and “ECO” produces a coarse diagnostic summary of model outputs - time series of the daily-interval masses of each of the main state variables in the model.
To load the 1970-1999 North Sea model, run and view the results:
model <- e2e_read("North_Sea", "1970-1999",silent=TRUE) # Read the 1970-1999 North Sea model from within the package
results <- e2e_run(model,nyears=3)                      # Run the model for 3 years
e2e_plot_ts(model,results,"ECO")                        # Plot time series of the output variables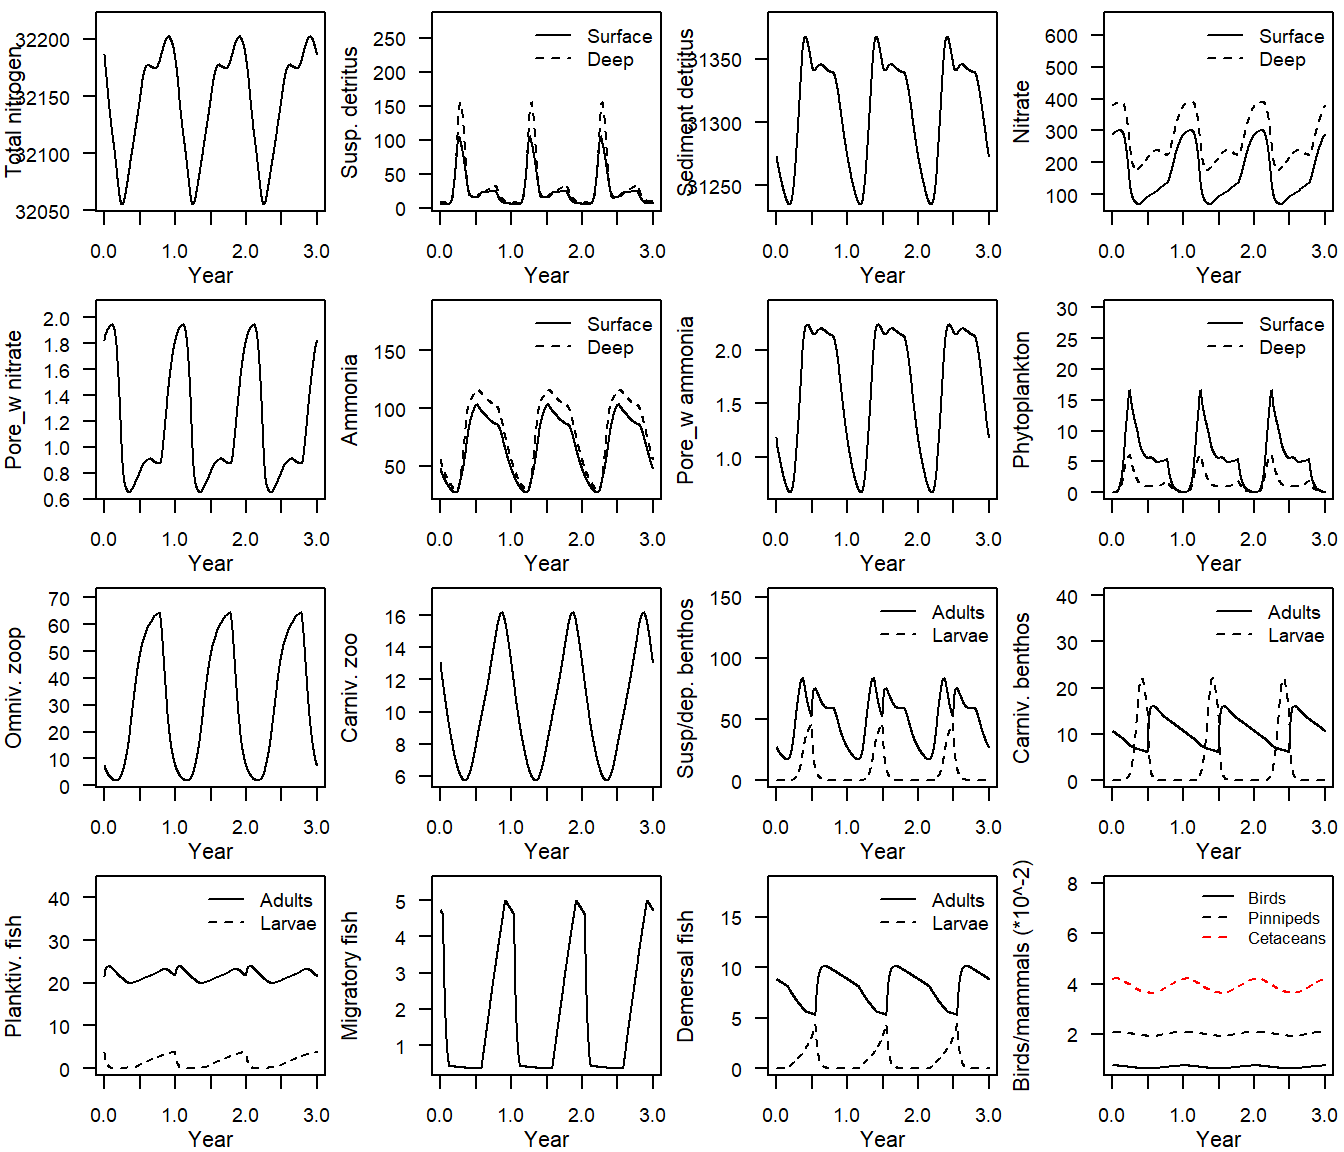
Figure 4. Time series output from the 1970-1999 North Sea model included in the package.
You will note that these model results show exactly repeating annual cycles of outputs. We refer to this as a steady or stationary state. The driving input data to the model are exactly repeating annual cycles of climatologically average environmental conditions in this case for the period 1970-1999 in the North Sea. The model has previously been run until the the annual cycles of output are also exactly repeating. Then, the values of all the variables at the end of a year are saved and used for subsequent re-starts of the model.
Replacing the argument “ECO” with “CATCH” produces a summary of the time series of annual integrated fishery catch outputs from the model brohen down by spatial zone, landings and disacards:
e2e_plot_ts(model, results,selection="CATCH")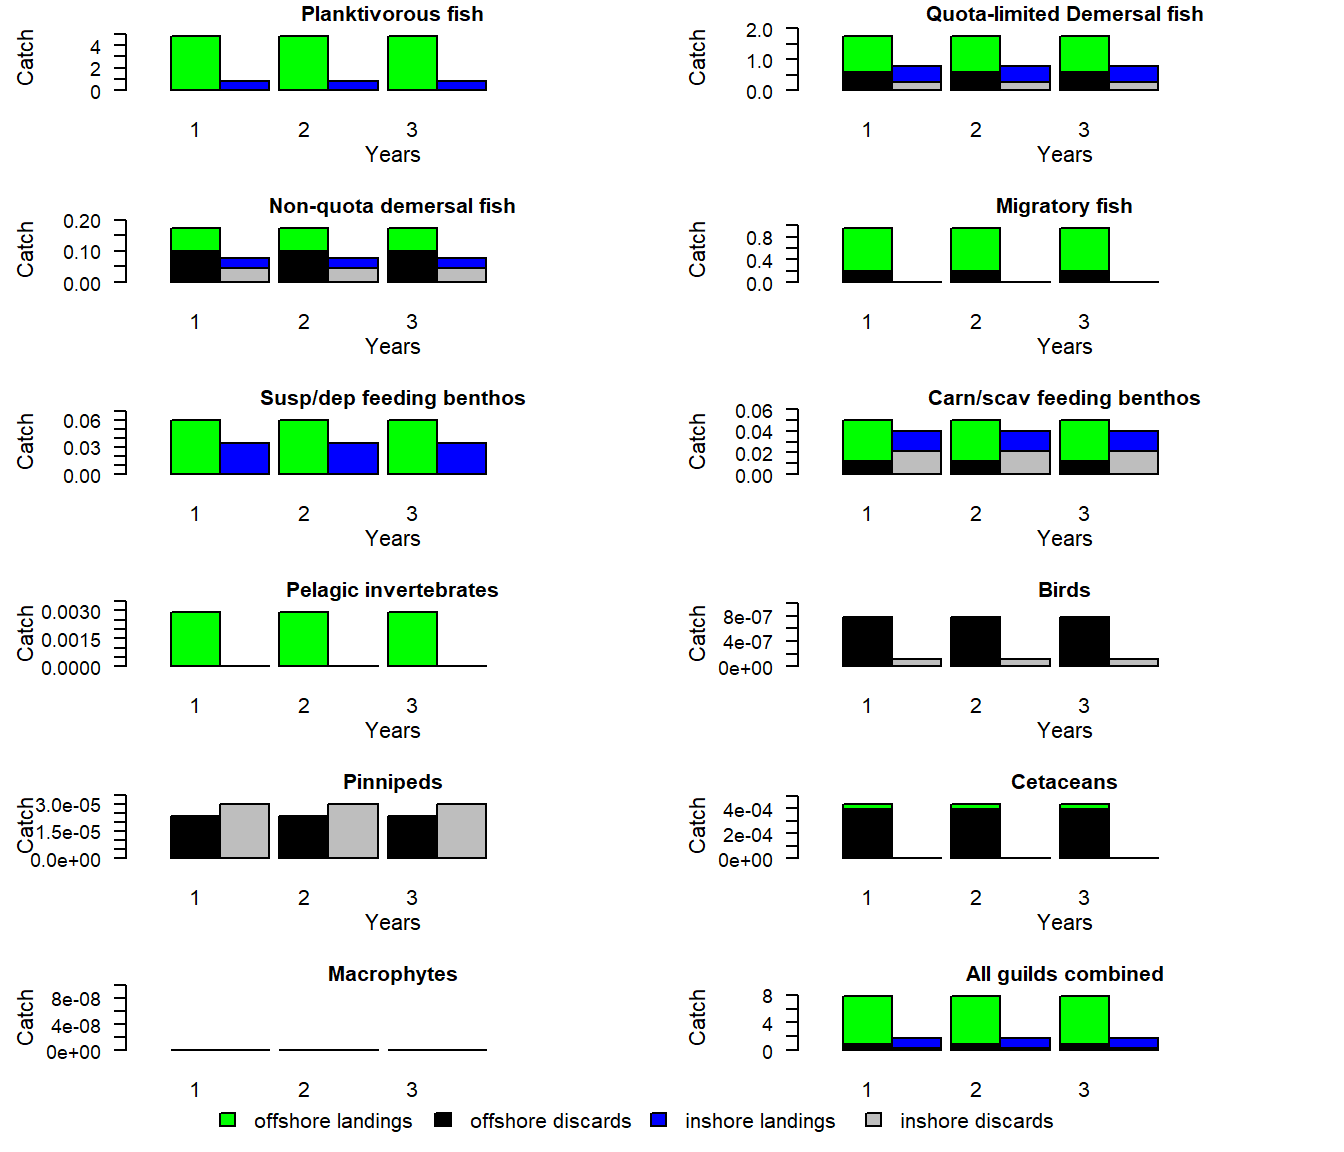
Figure 5. Time-series plot of catch data output, units mMN.y-1 in the model domain as a whole (1m-2 sea surface).